
|
As a team, we are in the process of wrapping up a few projects and brainstorming ideas to start another set of projects before the end of the quarter. Mark is taking the lead on adding features to customize new supply chains in the future and also to edit the already existing ones. This will enable the user to create a web application tailored to their needs simply by filling out fields in a form. This week he worked on the framework for the user interface and shared his ideas with us. We discussed the layout of this part of the app and how each step is going to be organized so that it is intuitive for the user. We looked at different examples such as google forms and canvas to inform our designs. Mark drew some mockups of each page on the form and walked us through it, and we gave him feedback about what can be improved. Senem and Maria finished the design of FCCI form for the app. They were having some issues with compatibility with the codebase when trying to add their changes, so they worked together with Austin and Mark to solve this problem. We first thought of concepts such as type intersection/union, but then Austin came up with the idea of using generic functions to intake arguments with arbitrary types. This was an important shift in our implementation. There are still a few issues with this implementation that we can hope we can solve later this week. Senem and Maria also added features such as units and error messages to the textfield, so that the units appear (eg, kg next to the weight of a unit), and the textfield does not accept any input besides numbers. However, Senem and Maria are waiting to solve the compilation errors to be able to test these added features. In terms of next projects, Austin is going to be working on adapting the app to mobile phones so that Zorzal workers can put information into the database without needing to go back and forth from the computer. Austin is also working on allowing users to add pictures to the forms that we will then store in the database. Senem and Maria are also in the process of pinpointing their individual projects. Some options are converting the program into Spanish and/or having multiple language options, working on the customization of the forms specifically, working on the design of the mobile phone version of the app, or working on the back-end to figure out better ways to store information in sheets documents. No matter which path we end up taking, we are very excited about what this quarter will bring to our project! 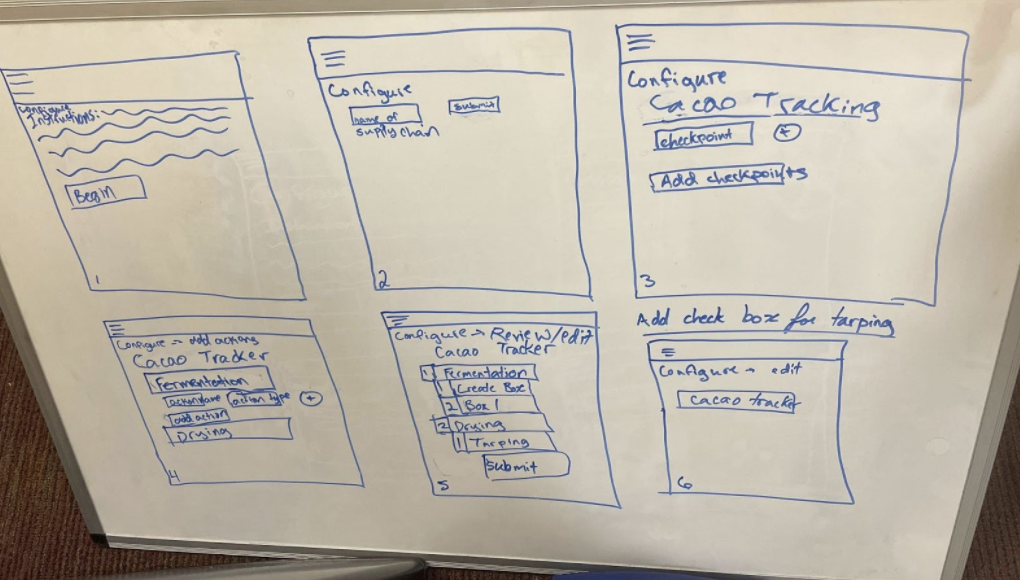 Above is a mock-up of the pages for supply chain customization.
0 Comments
This week Senem and I worked on the mock up for our new project. We thought about creating a ‘Report’ feature, where Zorzal employees could see the daily activity of the cacao shipments. We thought of the Report as being an inverted version of the already existing Search feature. In Search, users can look up a specific barcode and retrieve information about that shipment (dates and times, forms, boxes inside the shipment, etc). But, you can’t see the big picture. You can’t analyze trends in the short or long term. With a Report, on the other hand, Zorzal employees could do just that. 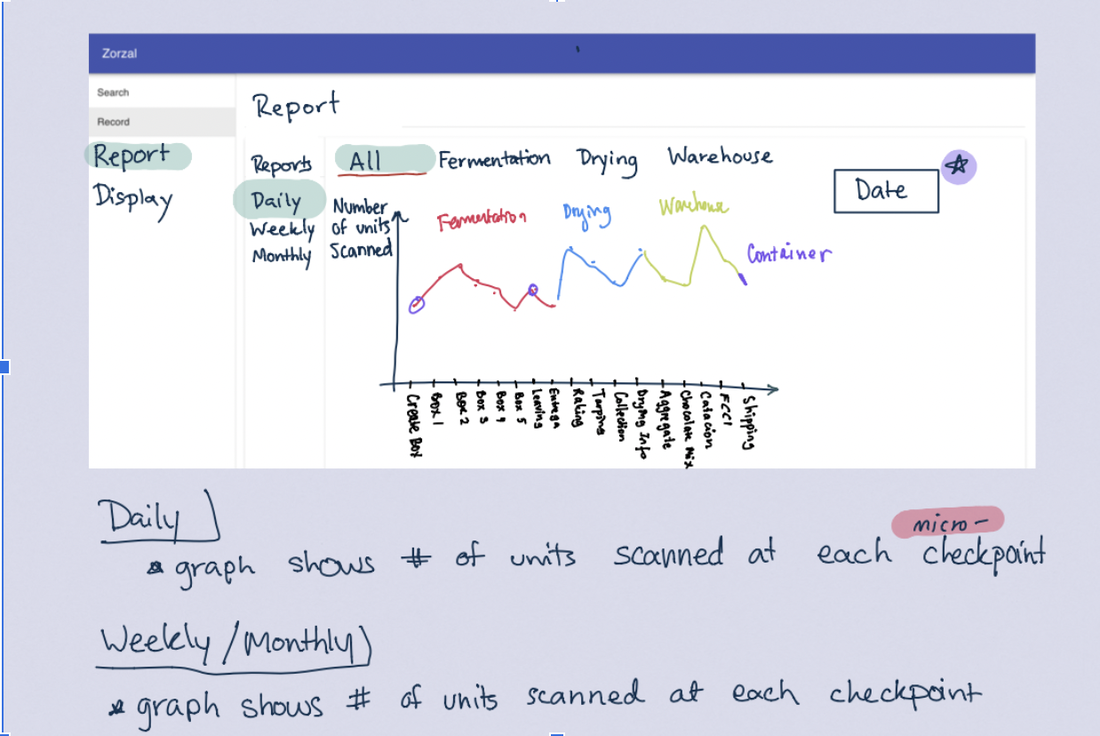 We are thinking of creating daily, weekly, and monthly reports (as shown above). They would each consist of a graph that plots the number of units scanned through each checkpoint. For the ‘Daily’ plot, the graph would only show data from the current day. And, for the ‘Weekly’ and ‘Monthly’ plots, the graphs would show data from the past week or month, respectively. As you can see from the picture above, we have color coded the different checkpoints. That’s because there would also be different graphs depending on whether the user wanted to zoom in on a specific checkpoint or just view the general trend. In other words, the user could select “Fermentation” and only the shipments in fermentation would be plotted; the x-axis would only show the action checkpoints for “Fermentation”. We were also thinking of creating a function that would allow the user to compare two different times. For example, if the user was checking out the Daily Report, they could go to the Date icon and pick two different days and the plots for both days would show up in the graph. The same would go for the weekly and monthly graphs. 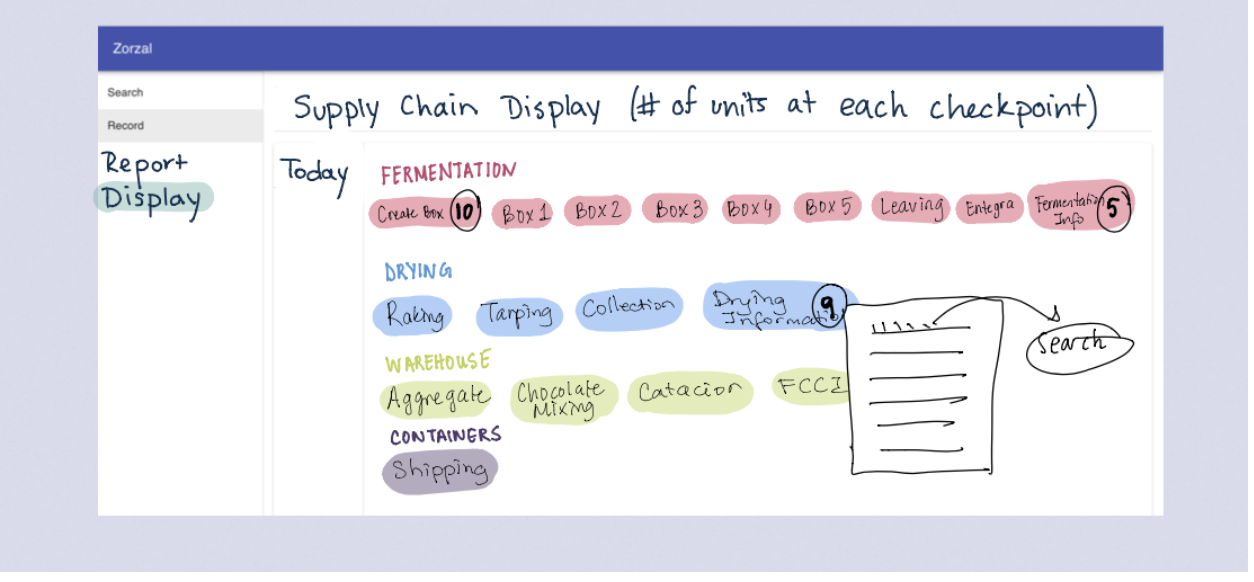 The next feature we were thinking of incorporating is a visual representation of the Zorzal supply chain (shown above). This is meant to display the same information as the graph but in a different way. In this graphic, we would have boxes with the name of the action point and the number of shipments that passed it. There would also be arrows depicting the movement of the cacao (not shown). Also, if you were to hover over a box (look at Drying Information 9), a small pop up would list additional information regarding the shipments—this is still up for discussion.
As for next steps, Senem and I will be working on extracting data from Firebase and connecting it to the graphs. We also hope to talk to Charles soon and get feedback. But, even if Charles does not find these graphs useful, it will still be valuable to learn how to retrieve this data. These past two weeks Maria and Senem have been working on making the forms more customizable and uniform. Right now the forms that Zorzal employees have access to only have text field boxes. However, this is a problem because it allows for too much freedom, which can lead to faulty answers. For example, if we use a text field and prompt the user to enter a date, the user could write it in a number of different ways (November 23rd, 2020; Nov 23, 2020; 11/23/2020; 23/11/2020). If instead of using a text field we were to use a date component, the user would not need to worry about the correct formatting. It would also be easier for the user because they could select the date from a calendar rather than typing it out. And, more importantly, data would be collected in a more consistent manner. Because we will be recording information in a google sheet and potentially analyzing it, it’s important to keep a standard format. As for customizability, Maria and Senem have been adding the radio, date, and slider elements into Firebase so that Zorzal employees can edit forms if they want to. For example, if they want to add a new field that prompts the user to select between three fermentation states, they could insert a radio element and choose the number of options—in this case three. This is important because we will not be working on the web app forever, so they have to have a way of editing the forms without having to know the code from React. 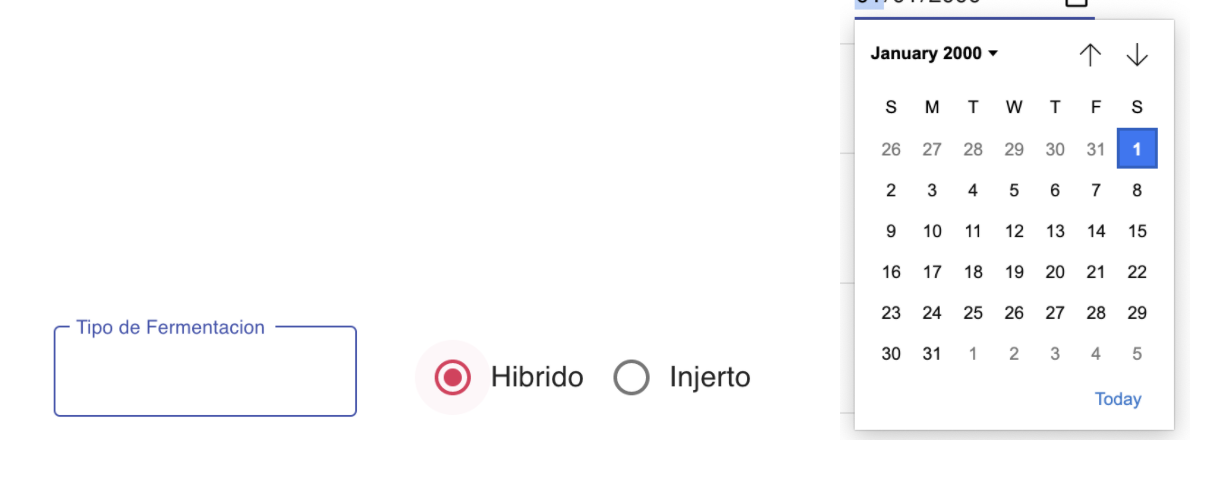 Austin and Mark have also been teaching Maria and Senem more React concepts like state. They went over the functionality and the relevance of the functions. State is used to record and store the input from the user. Without it, data would be passed in but it wouldn’t be attached to anything. There would be no way of keeping track of a shipment and its different characteristics—farm, date, forms, etc. Meanwhile, Austin and Mark have been making some changes to the app. For example, they worked on saving the data from the web app and storing it in google sheets so that Zorzal can keep track of barcodes, dates, and other relevant information in an organized way. They also incorporated form formatting to allow users to specify categories and subcategories. At the same time they adjust the existing layout to make the web app compatible with mobile devices.  |
 RSS Feed
